Arctic Sea Ice Loss
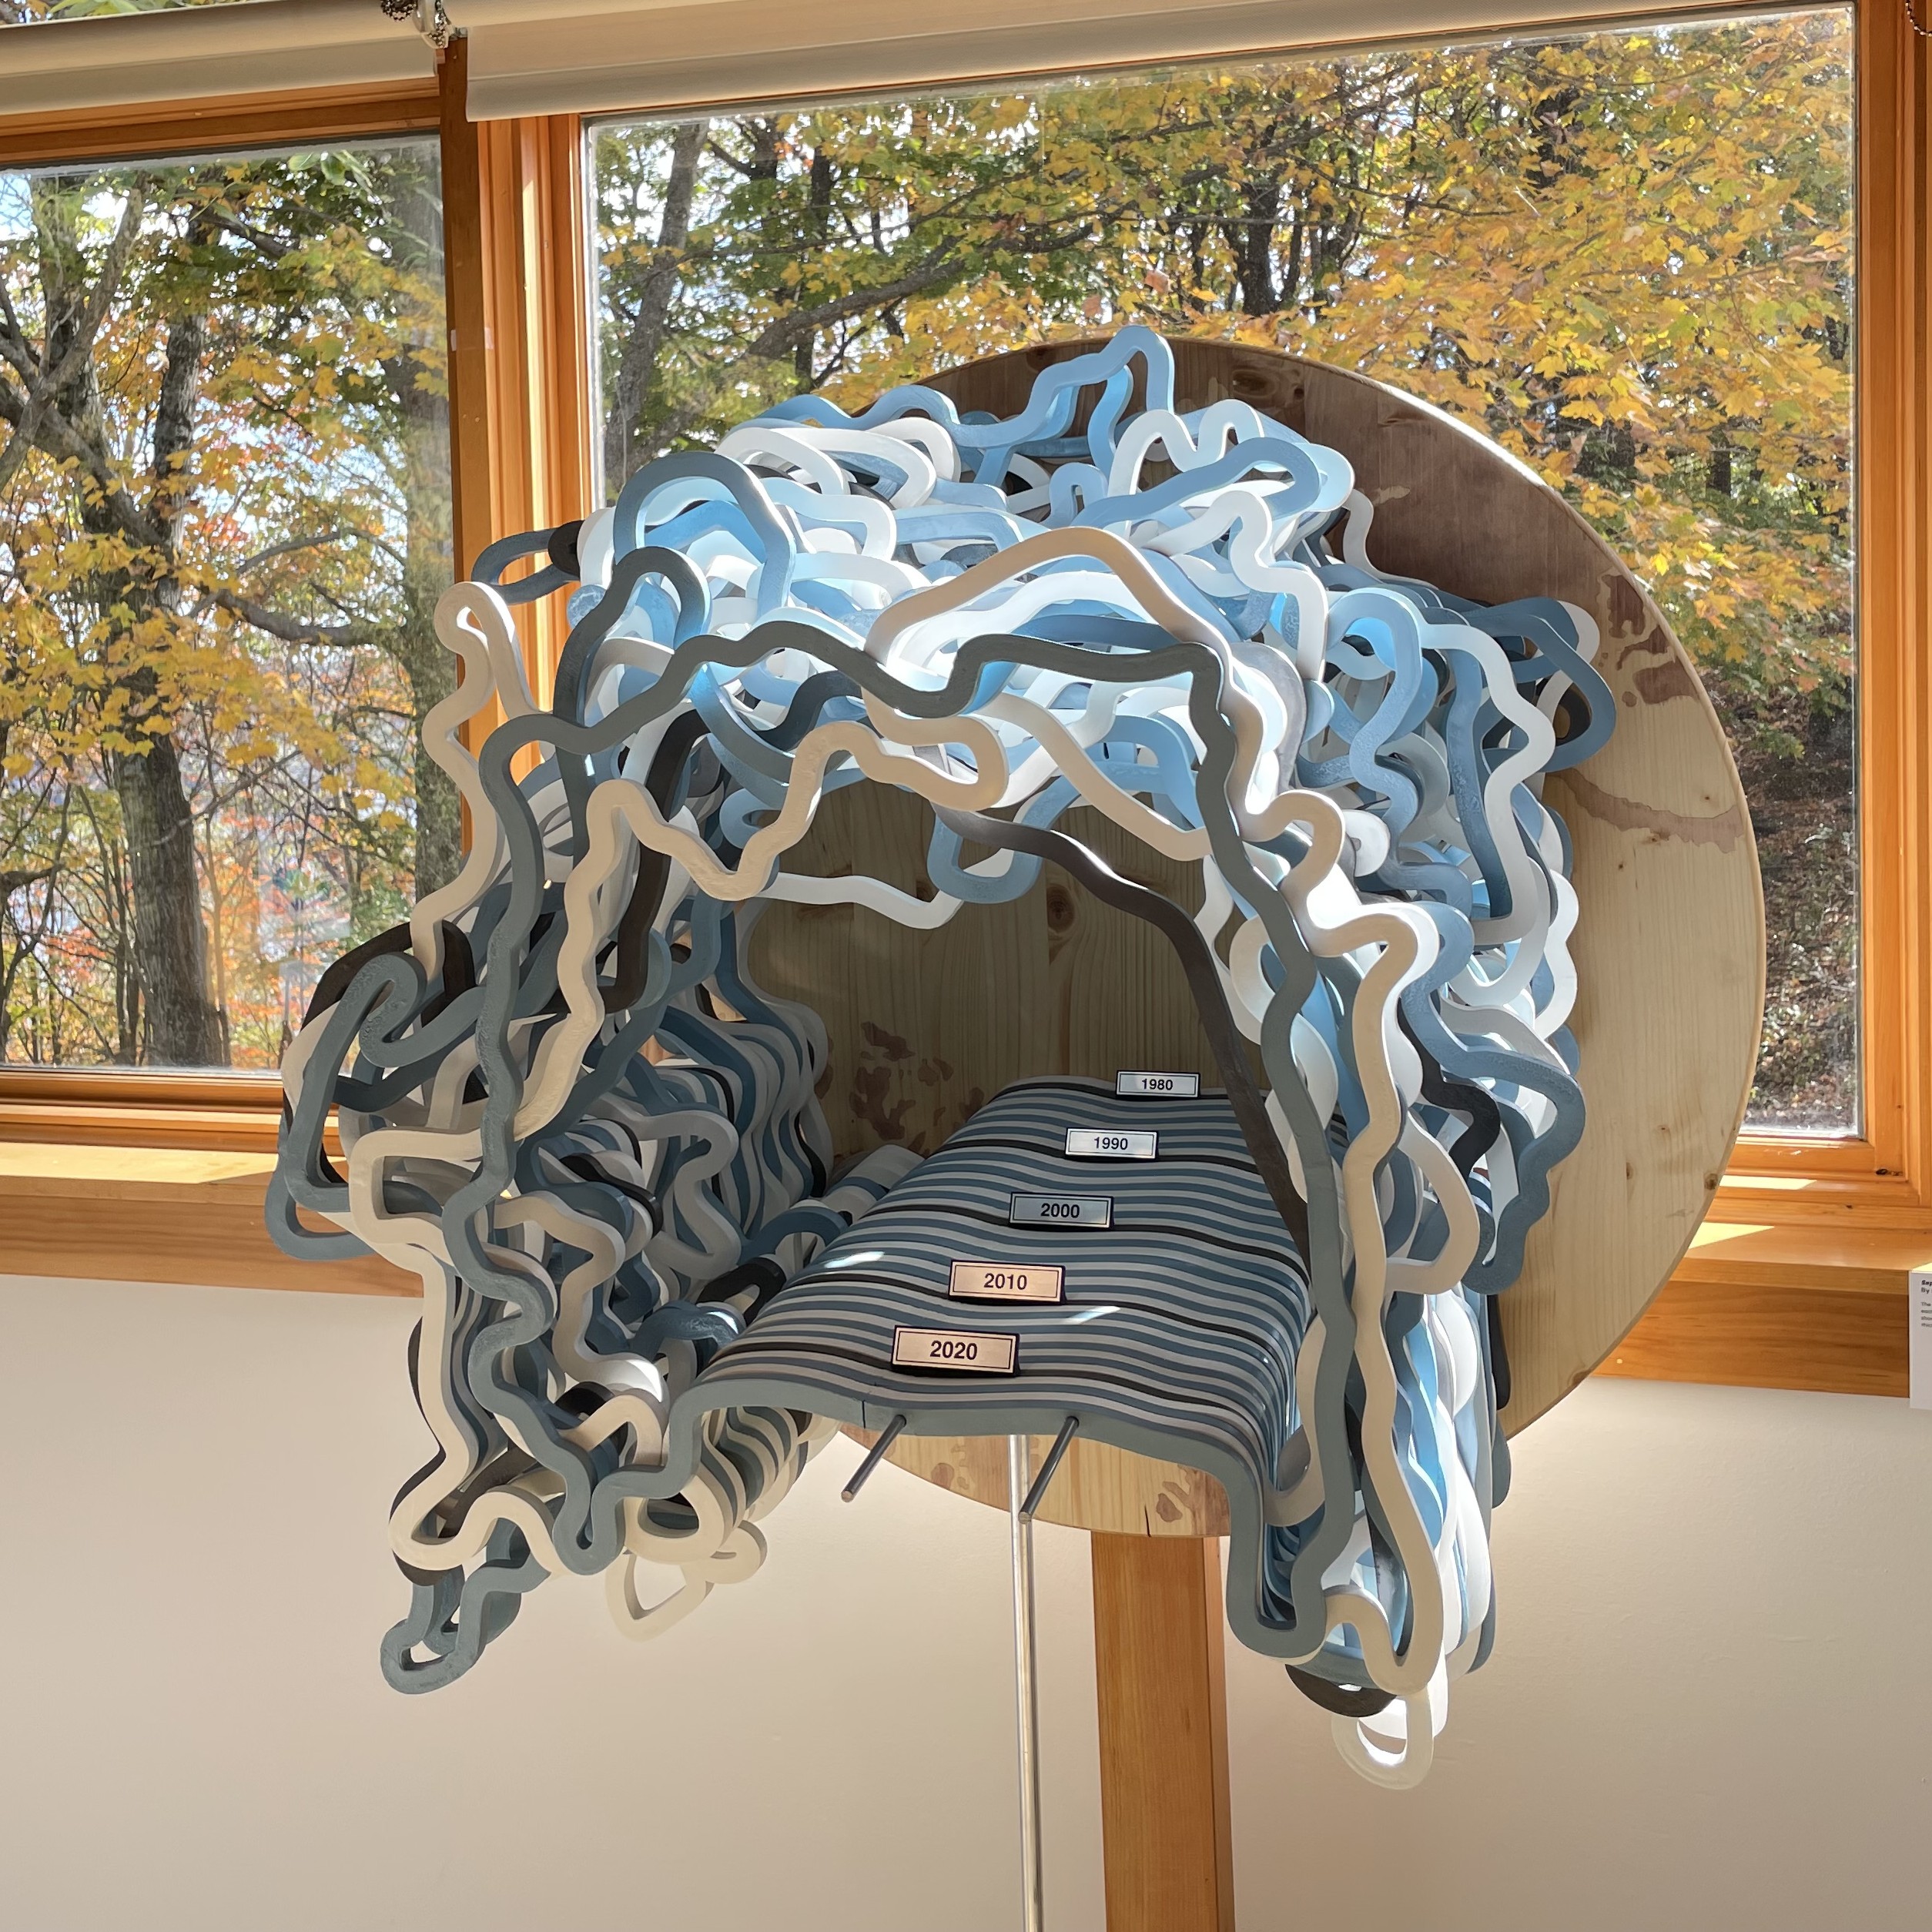
Sculpture of September Arctic Sea Ice Volume Since 1979
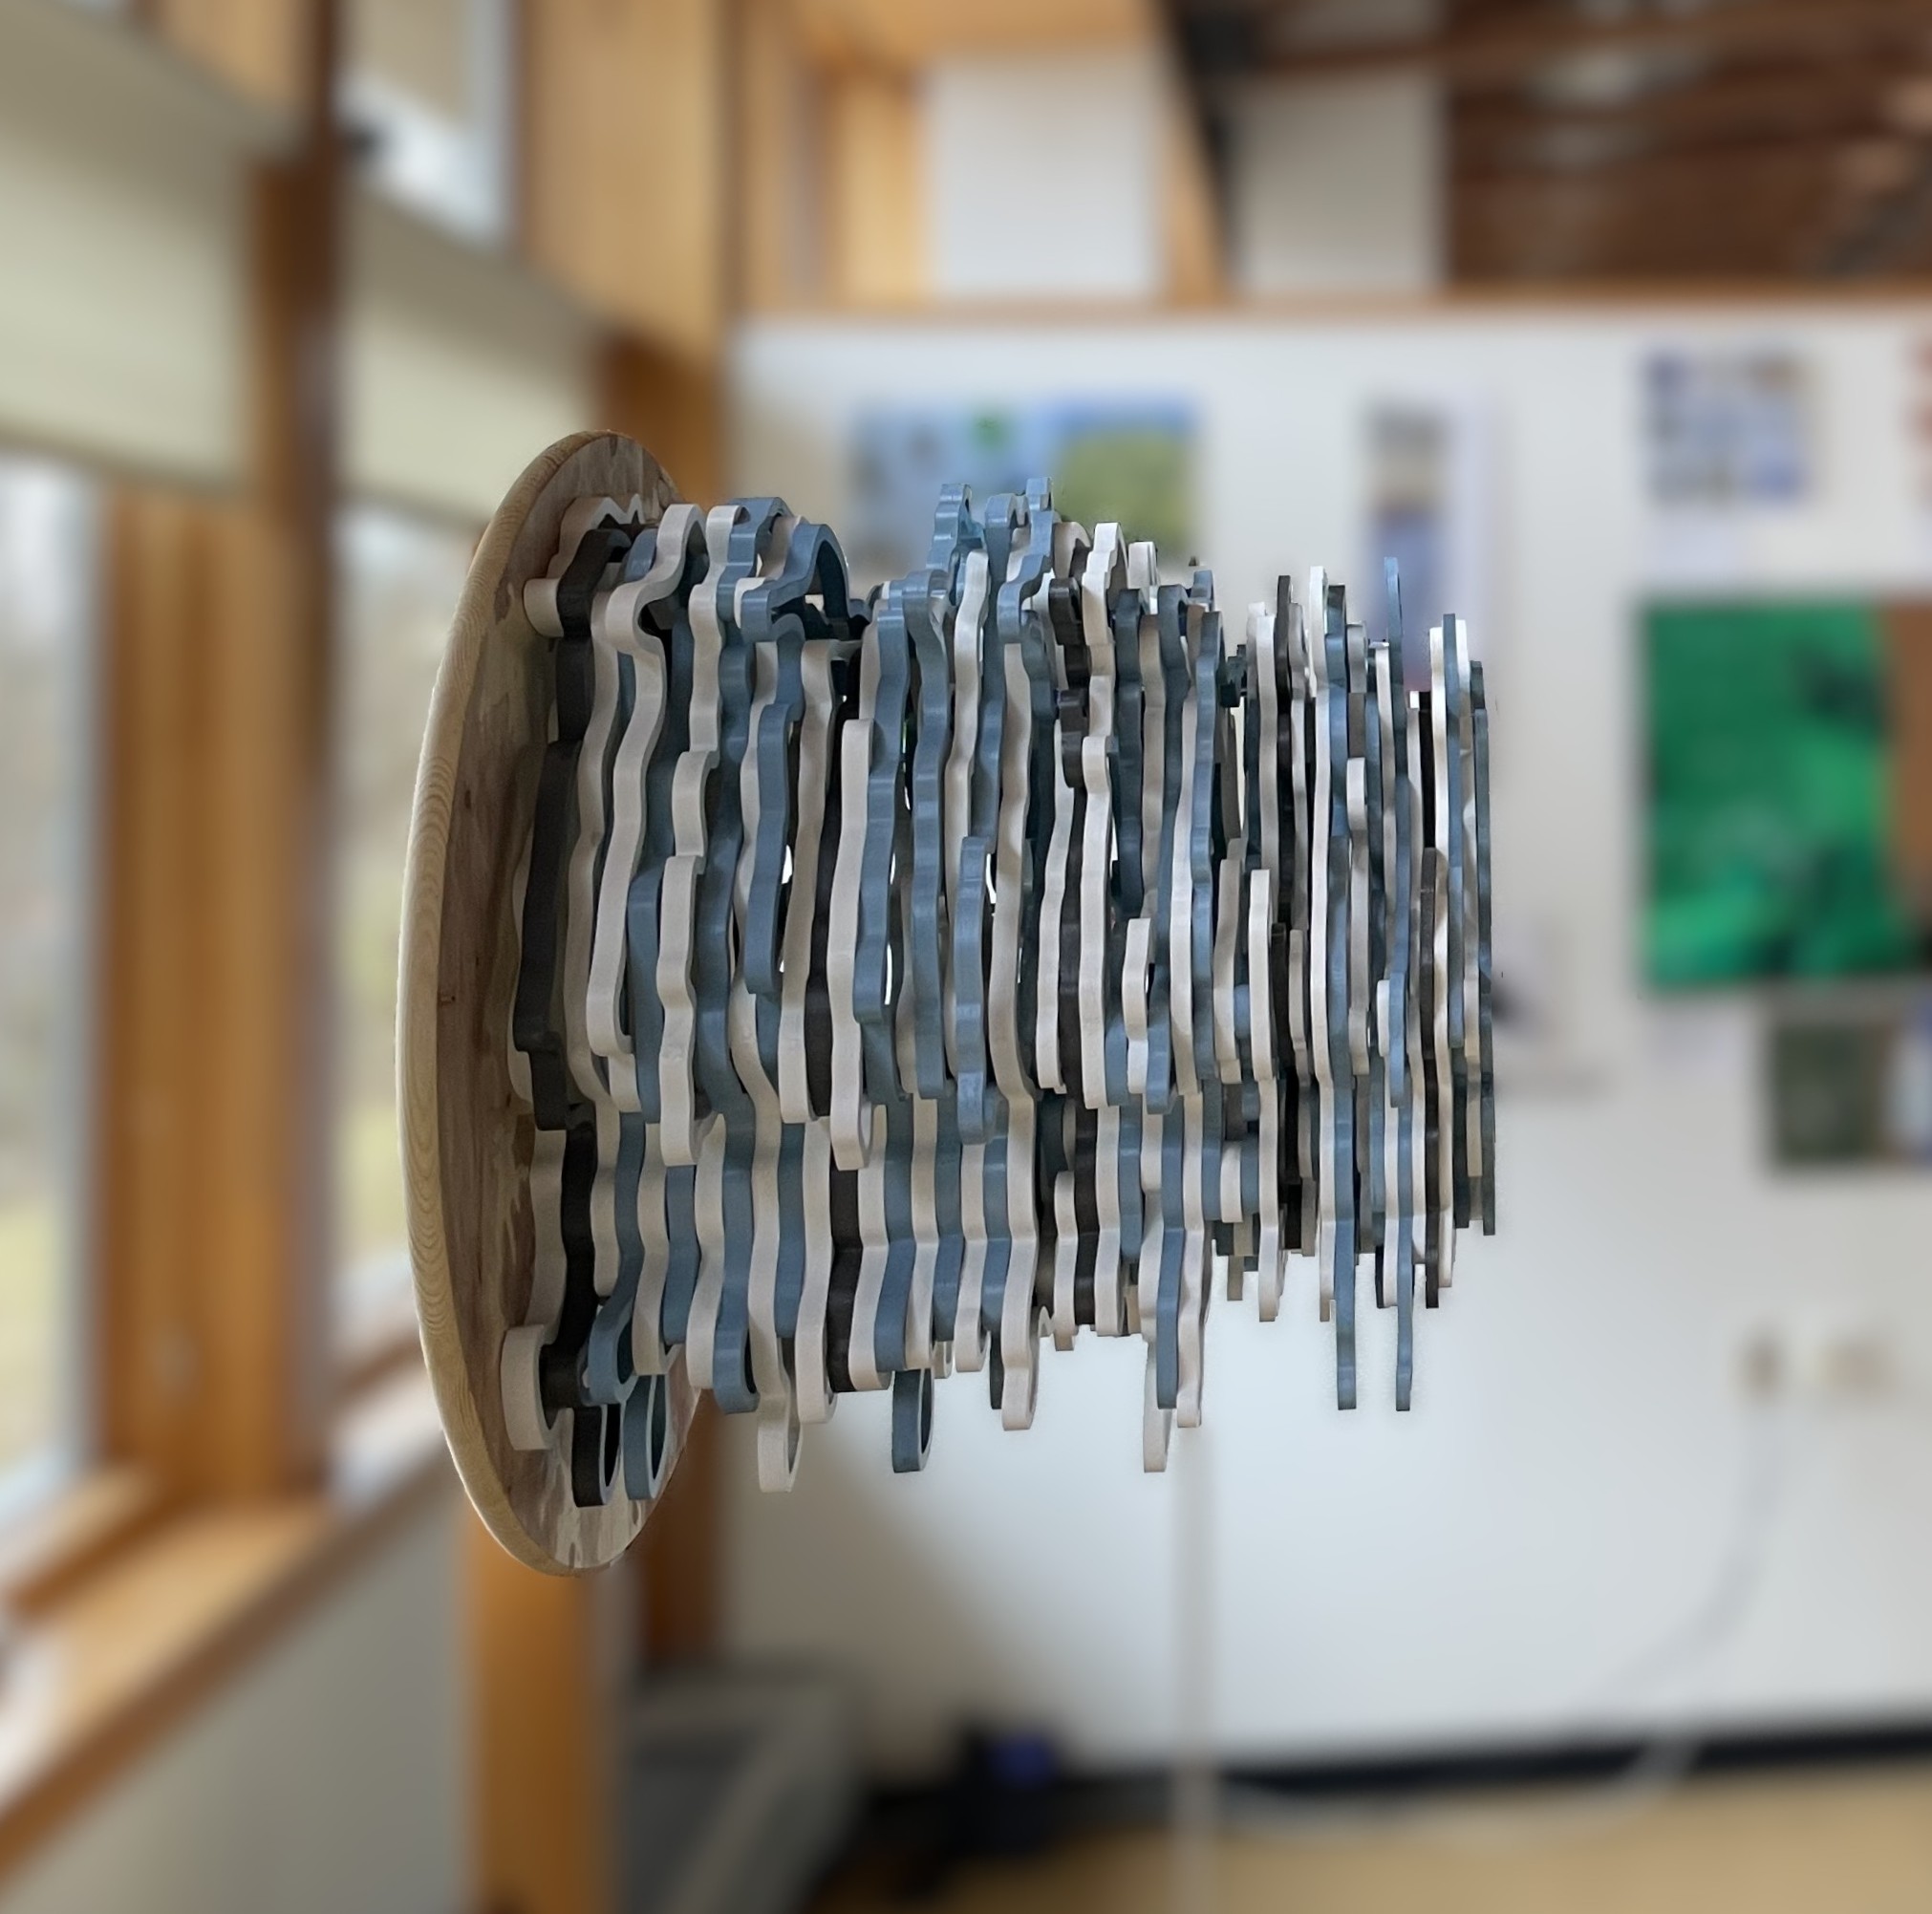
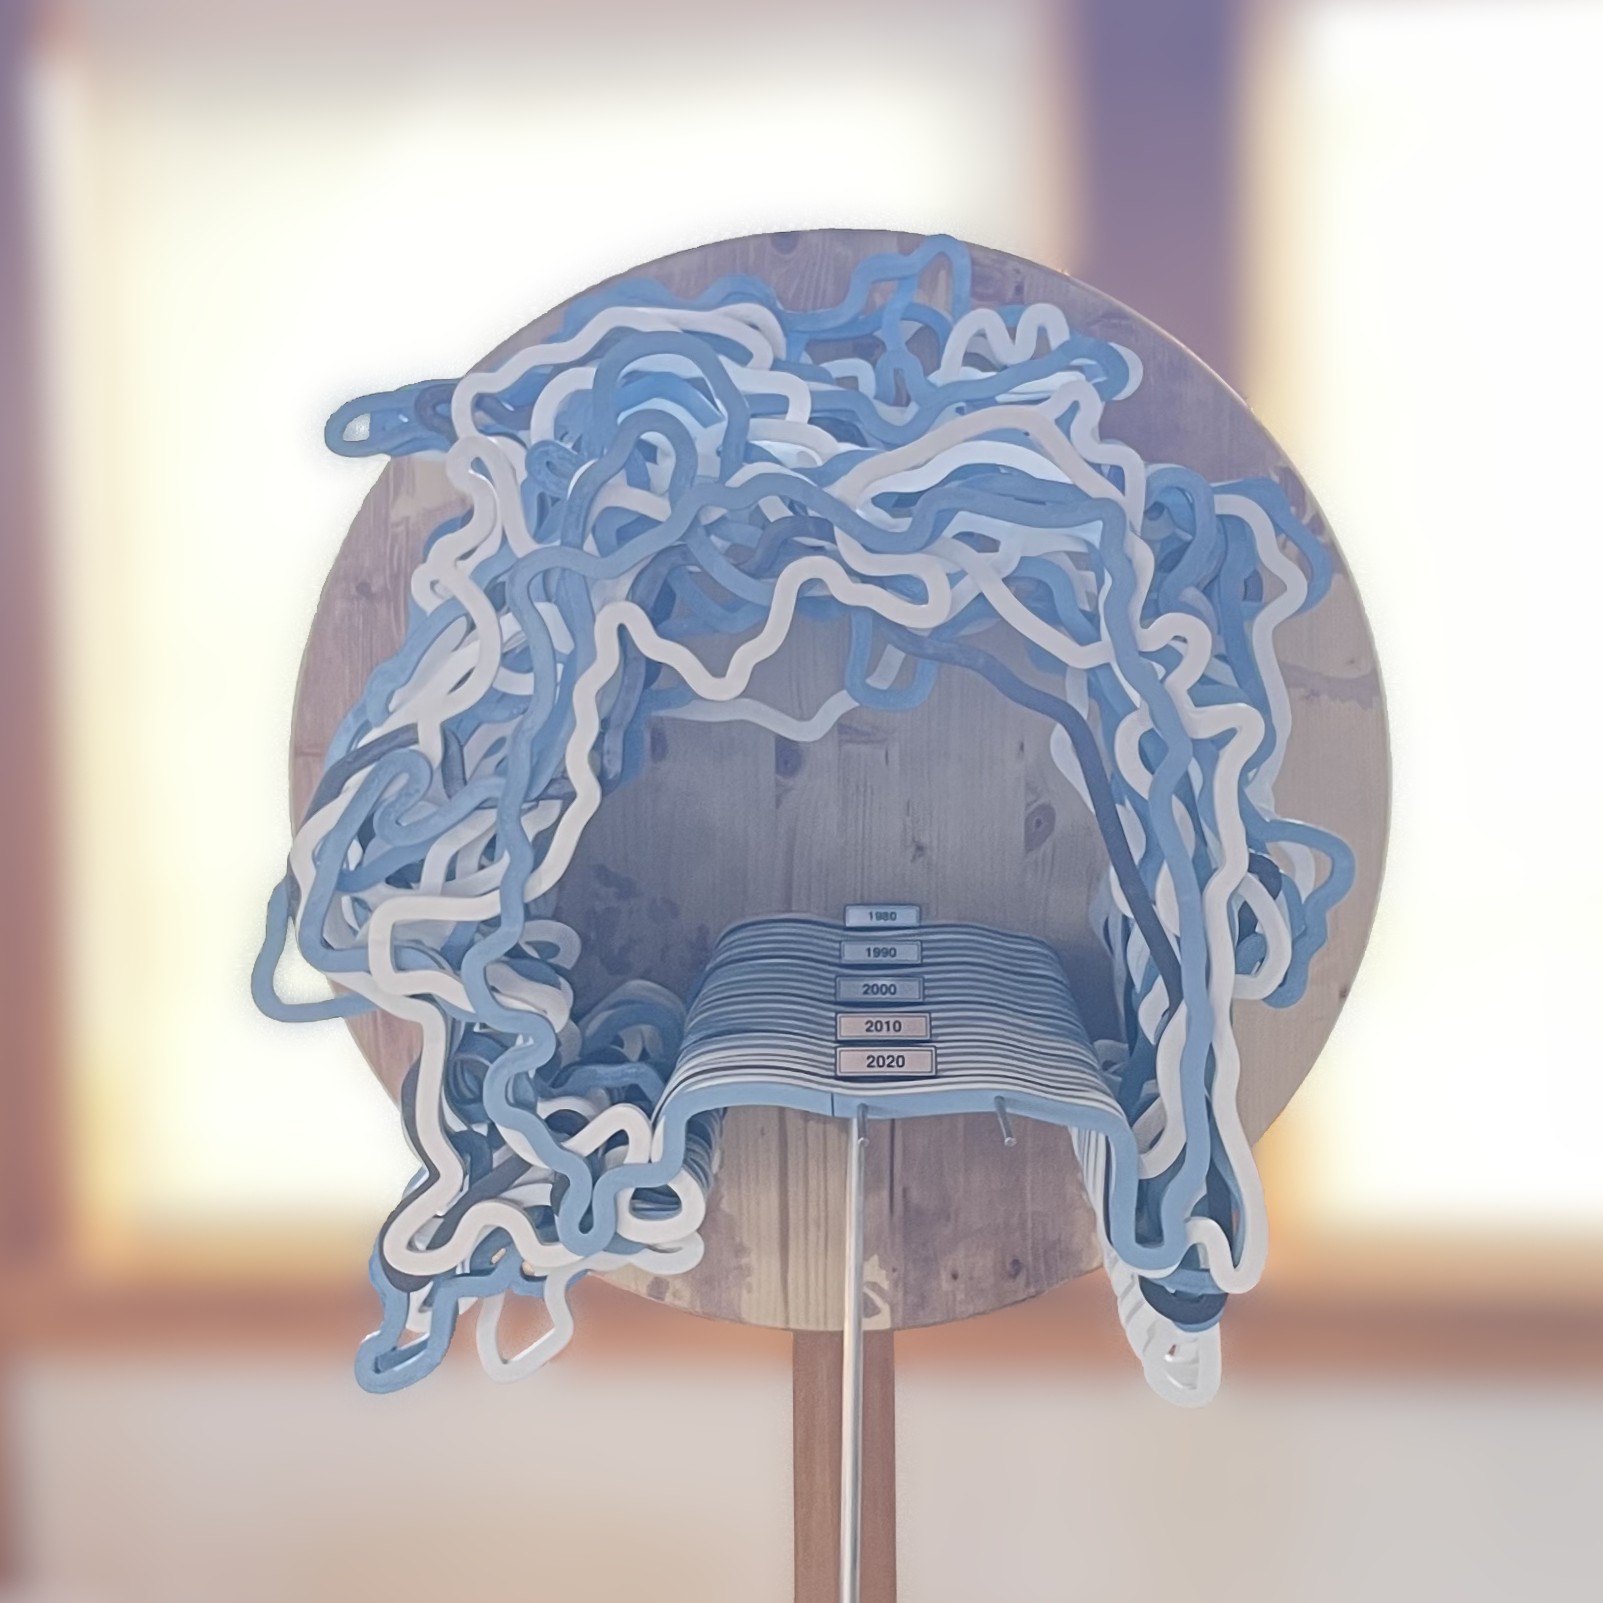
The stacked layers of this living sculpture depict maps of the Arctic sea ice pack from every September since the start of the satellite record, with the thickness of each layer corresponding to the mean thickness of the ice, reflecting the total volume change over time. The sea ice reaches a minimum in September, meaning ice that survives through September will likely see another winter.
Use of all three spatial dimensions imparts a visceral understanding of the volume loss, conveying both the decadal mean trend and the year-to-year variability in a way that is unachievable in two-dimensional media. This piece is currently on display in the Monell building lobby on the Lamont-Doherty Earth Observatory campus. A new layer will be added every year until the ice runs out.